| Contents: | back to main page |
| Figures | ||||
| σ 1,2 | GO79 | |||
| σ 1,0 | GO79 | DA98 |
Figures
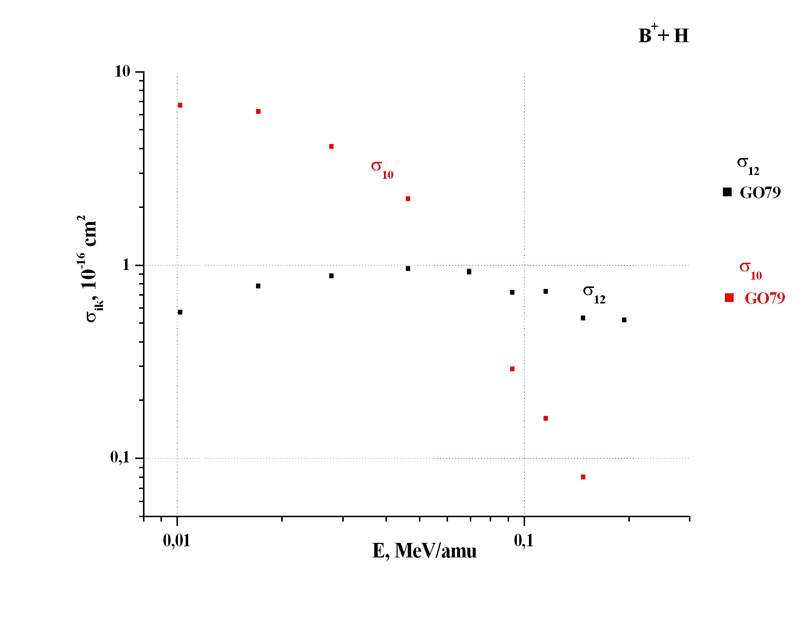
B + + H → B 2+
Table 1 (Experiment)
T.V.Goffe, M.B.Shah,H.B.Gilbody // J.Phys. B v.12 p.3763 (1979)
| E, MeV/amu | E, MeV | σ 1,2 , 10 -16 cm 2 |
| 0.0102 | 0.110 | 0.57 ± 0.16 |
| 0.0171 | 0.185 | 0.78 ± 0.13 |
| 0.0278 | 0.300 | 0.88 ± 0.14 |
| 0.0463 | 0.500 | 0.96 ± 0.13 |
| 0.0694 | 0.750 | 0.92 ± 0.15 |
| 0.0926 | 1.000 | 0.72 ± 0.11 |
| 0.1157 | 1.250 | 0.73 ± 0.11 |
| 0.1481 | 1.600 | 0.53 ± 0.09 |
| 0.1944 | 2.100 | 0.52 ± 0.10 |
B + + H → B 0
Table 2 (Experiment)
T.V.Goffe, M.B.Shah,H.B.Gilbody // J.Phys. B v.12 p.3763 (1979)
| E, MeV/amu | E, MeV | σ 1,0 , 10 -16 cm 2 |
| 0.0102 | 0.110 | 6.7 ± 1.0 |
| 0.0171 | 0.185 | 6.2 ± 0.7 |
| 0.0278 | 0.300 | 4.1 ± 0.4 |
| 0.0463 | 0.500 | 2.2 ± 0.3 |
| 0.0694 | 0.750 | 0.93 ± 0.12 |
| 0.0926 | 1.000 | 0.29 ± 0.05 |
| 0.1157 | 1.250 | 0.16 ± 0.02 |
| 0.1481 | 1.600 | 0.08 ± 0.02 |
Table 3 (Theory, boundary-corrected continuum intermediate state approximation)
M. Das, M. Purkait, C.R. Mandal // Phys. Rev. A v.57 p.3573 (1998)
| E, MeV/amu | σ 1,0 , 10 -16 cm 2 |
| 0.025 | 5.38 |
| 0.030 | 4.19 |
| 0.040 | 2.48 |
| 0.050 | 1.52 |
| 0.060 | 0.974 |
| 0.080 | 0.431 |
| 0.100 | 0.212 |
| 0.200 | 0.0167 |