| Contents: | back to main page |
| Figures | ||||
| σ 6,5 | TO70 | TO73 | TA74 | AN88 |
Figures
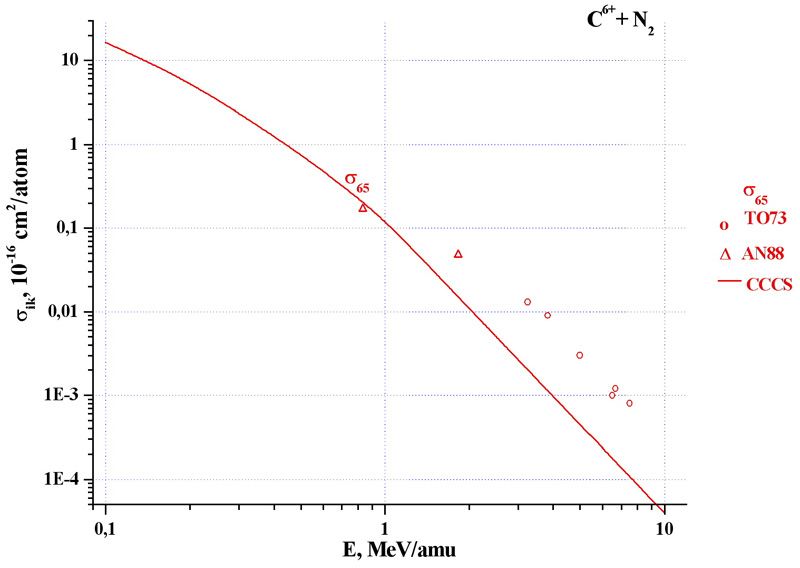
C 6+ + N 2 → C 5+
Table 1 (Experiment)
T. Tonuma,Y.Miyazawa,T.Karasawa,I.Kohno// Jap.J.App.Phys. v.9 p.1306 (1970)
| E , MeV/amu |
E, MeV |
σ 6,5 , 10 -16 cm 2 /atom |
| 3.25 | 39.0 | 0.017 ± 0.003 |
| 4.17 | 50.0 | 0.0050 ± 0.0020 |
| 6.50 | 78.0 | 0.0017 ± 0.0010 |
Table 2 (Experiment)
| E , MeV/amu |
E, MeV |
σ 6,5 , 10 -16 cm 2 /atom |
| 3.25 | 39.0 | 0.013 |
| 3.83 | 46.0 | 0.009 |
| 5.0 | 60.0 | 0.003 |
| 6.50 | 78.0 | 0.001 |
| 6.67 | 80.0 | 0.0012 |
| 7.50 | 90.0 | 0.0008 |
Table 3 (Experiment)
Yu.A. Tashaev // Thesis, Institute of Nuclear Physics, Moscow, (1974)
| E , MeV/amu |
V, 10 8 cm/s |
σ 6,5 , 10 -16 cm 2 /atom |
| 0.334 | 8.0 | 1.2 |
Table 4 (Experiment)
| E, MeV/amu | E, MeV | σ 6,5 , 10 -16 cm 2 / atom |
| 0.833 | 10.0 | 0.17 |
| 1.83 | 22.0 | 0.048 |