| Contents: | back to main page |
| Figures | |
| σ 1,2 | LO70a |
| σ 1,0 | LO70a |
Figures
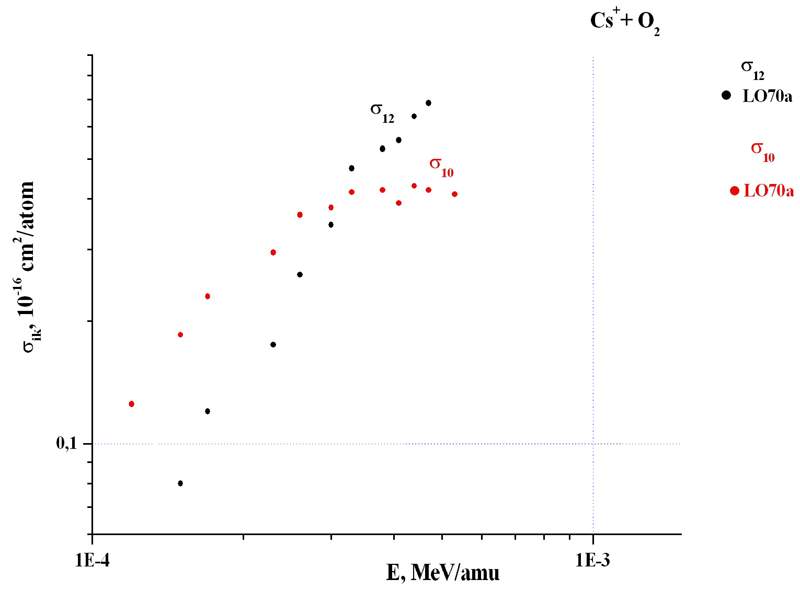
Cs + + O 2 → Cs 2+
Table 1 (Experiment)
H.H. Lo, W.L. Fite // At. Data, 1, 305 (1970)
| E , MeV/amu |
V, 10 8 cm/s |
σ 1,2 , 10 -16 cm 2 | σ 1,2 , 10 -16 cm 2 /atom |
| 0.00015 | 0.17 | 0.16 | 0.080 |
| 0.00017 | 0.18 | 0.24 | 0.120 |
| 0.00023 | 0.21 | 0.35 | 0.175 |
| 0.00026 | 0.22 | 0.52 | 0.260 |
| 0.00030 | 0.24 | 0.69 | 0.345 |
| 0.00033 | 0.25 | 0.95 | 0.475 |
| 0.00038 | 0.27 | 1.06 | 0.530 |
| 0.00041 | 0.28 | 1.11 | 0.555 |
| 0.00044 | 0.29 | 1.27 | 0.635 |
| 0.00047 | 0.30 | 1.37 | 0.685 |
Cs + + O 2 → Cs 0
Table 2 (Experiment)
H.H. Lo, W.L. Fite // At. Data, 1, 305 (1970)
| E , MeV/amu |
V, 10 8 cm/s |
σ 1,0 , 10 -16 cm 2 | σ 1,0 , 10 -16 cm 2 /atom |
| 0.00012 | 0.15 | 0.25 | 0.125 |
| 0.00015 | 0.17 | 0.37 | 0.185 |
| 0.00017 | 0.18 | 0.46 | 0.230 |
| 0.00023 | 0.21 | 0.59 | 0.295 |
| 0.00026 | 0.22 | 0.73 | 0.365 |
| 0.00030 | 0.24 | 0.76 | 0.380 |
| 0.00033 | 0.25 | 0.83 | 0.415 |
| 0.00038 | 0.27 | 0.84 | 0.420 |
| 0.00041 | 0.28 | 0.78 | 0.390 |
| 0.00044 | 0.29 | 0.86 | 0.430 |
| 0.00047 | 0.30 | 0.84 | 0.420 |
| 0.00053 | 0.32 | 0.82 | 0.410 |